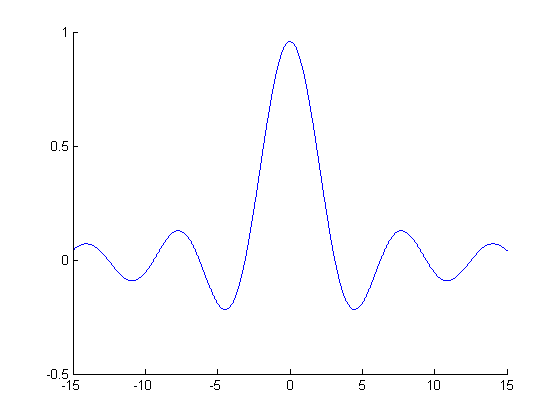
I immediately recognized it as the sinc function. It's a function that is extremely important in digital signal processing, and one that I see just about every day I'm in the lab. The sinc function is defined as:
In the case of the picture above, r is equal to:
and therefore, sinc(r) is equal to:
This is the partially obscured equation that you see in the picture. I noticed there was a bit of confusion about this equation in the comment section of IFLS, so I thought I'd clear a few things up.
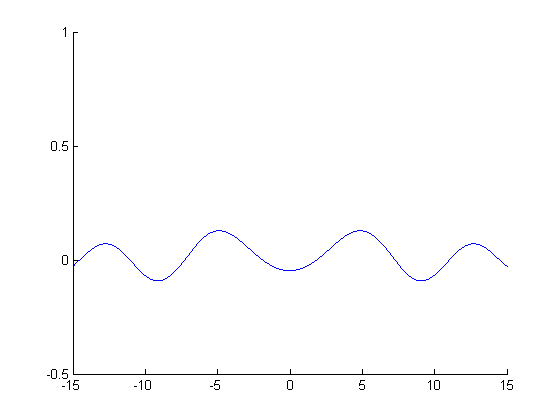
Many people assumed that the formula written on the front is incorrect. They noticed that plotting a function with x, y, and z variables would require a 4-dimensions. While that is true, it doesn't mean that the function is incorrect as written. The function is still correct as long as the z is defined as a variable that is not connected to the cartesian (x,y,z) coordinate system. In other words, z could be a time dependent variable or even a constant. When z = 0, the plot will look like this:

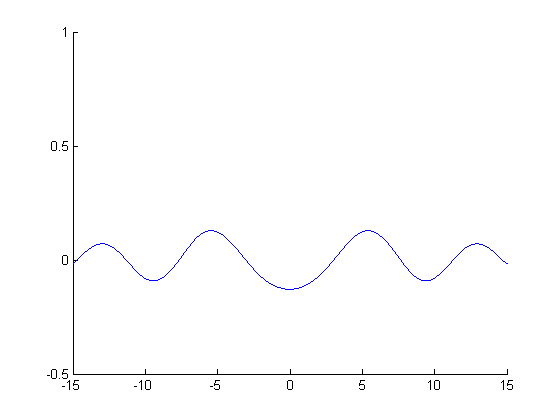
Which looks like the plot from the picture on IFLS. When we let z vary between 1 and 100 you can get a time dependent plot that looks like this:
This is a good example of why it's important to define your variables. If you don't define your variables they could mean anything. A variable can look familiar and mean something completely different. In this case, z is not the Cartesian coordinate z that you're used to seeing. Remember, a variable means nothing until you've defined it. c does not always mean the speed of light, r does not always mean radius, and so on.
Now to the fun part!
I used matlab to make a printable version of this craft. I suggest you print these pictures out on cardstock or the paper will droop down. Print each of the pictures (in order) and have fun putting them together!
Send me a picture of your finished product and I'll post it for everyone to see.
(If I get at least 5 submitted pictures I'll post pictures of the sad attempt that my 6 year old and I made)
Aaaaaannnnnnd GO!


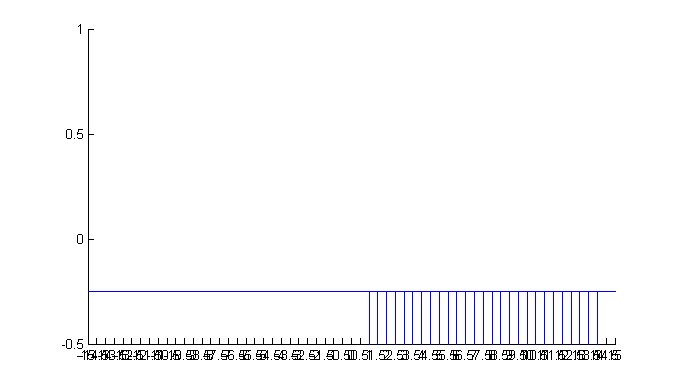
This final picture is a possible "base" for your plot. It's only half done (there should be blue lines along the entire axis). Cut two or three of these out and space them equal apart. Each tic mark along the x axis is where you should cut to place the cross sections you already cut out. This way the sinc(r) wave will be equally spaced in both directions (if you don't use this you could get an oval instead of a circle).